







- Home
- What's new at FocalScope
- CSAT vs NPS
Learn what CSAT and NPS really measure, when to use each one, and why tracking both gives you a complete picture of customer satisfaction and long term loyalty.

What is the difference between CSAT and NPS?
What is CSAT?
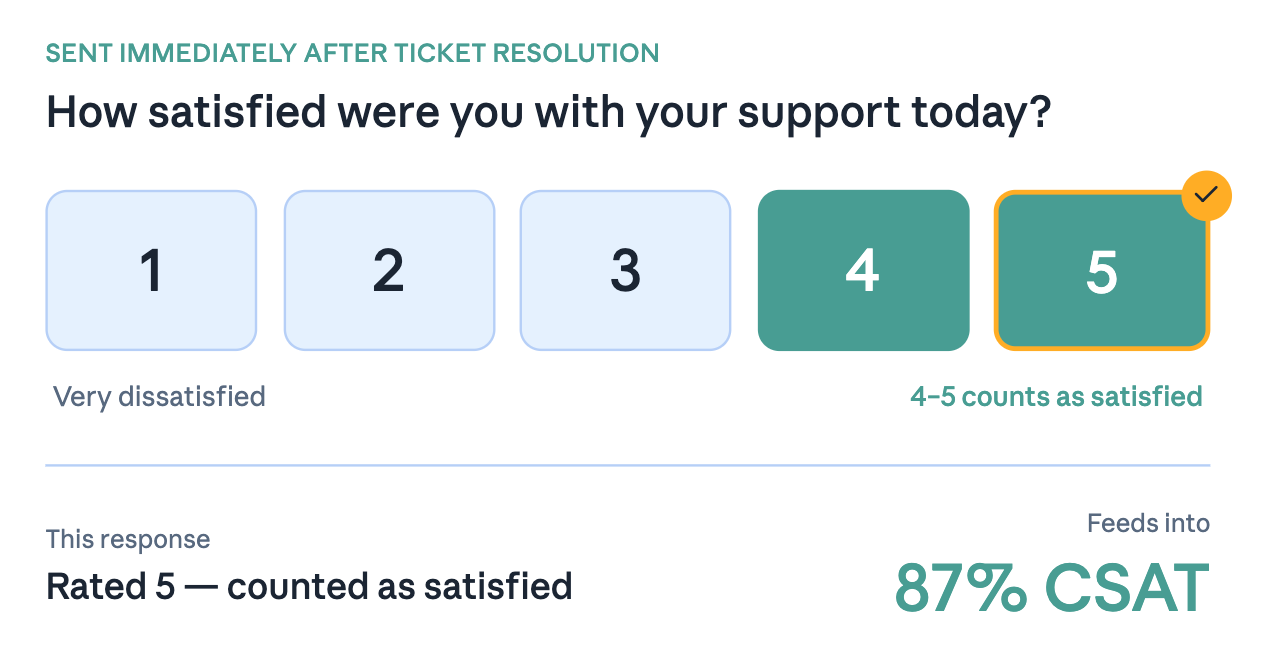
CSAT stands for Customer Satisfaction Score. It’s usually deployed ad hoc, triggered by one specific interaction — a support ticket, a call, a purchase, an onboarding session — and it measures only how the customer felt about that single experience.
That’s the common pattern, but it isn’t the definition. CSAT can also be sent on a scheduled cadence to the wider customer base, rather than triggered by a single ticket. Used this way, it can cover much more than one interaction, including how the customer feels about the business as a whole.
CSAT surveys are short by design when they’re ad hoc. A single question, tailored to the type of interaction the customer just had, goes out right after it, while the experience is still fresh.
The periodic version digs deeper. A customer on a contract or subscription can get several questions covering different aspects of the relationship, on a cadence rather than only after each transaction. FocalScope’s travel industry customers, who provide business and marine travel services, use it this way. Since the relationship is business-to-business rather than a single consumer trip, the survey reaches not just the traveller but also officials at the client company, such as a supply manager.
Typical CSAT question: “On a scale from 1 to 5, how satisfied were you with [company/interaction]?”
How do you calculate CSAT?
Add up the number of satisfied responses (usually ratings of 4 and 5), divide by the total number of responses, and multiply by 100.
CSAT = (Number of satisfied customers ÷ Total survey responses) × 100
A score of 80% means eight out of ten customers rated their experience positively. Below 75-80%, treat it as a warning, not a footnote.
CSAT isn’t only a single-interaction number. Keep the question wording fixed over time, and the same score becomes a trend line for the business as a whole, not just a snapshot of one ticket. Changing the wording to “customise” it resets that baseline and breaks the comparison.
High CSAT doesn’t guarantee loyalty. Picture a customer frustrated by your pricing or your product roadmap. They contact support with a simple question, your agent resolves it perfectly, and they leave a five star CSAT rating. That same customer might still give you an NPS score of three, because their problem was never with support. It was with the company. CSAT tells you your support team did their job. NPS tells you whether the rest of the business is doing theirs.
It’s also a clean illustration of ad-hoc versus scheduled CSAT. The ad-hoc survey here only ever asked about the ticket, so it had no way to surface the pricing or roadmap frustration. A scheduled CSAT with a pricing or roadmap question built in would have caught it directly, the same way NPS does in this example.
What is Net Promoter Score (NPS)?
NPS measures loyalty to your brand as a whole, not one interaction. It asks customers how likely they are to recommend you to someone else, and it’s widely used as a proxy for long-term customer loyalty and future advocacy.
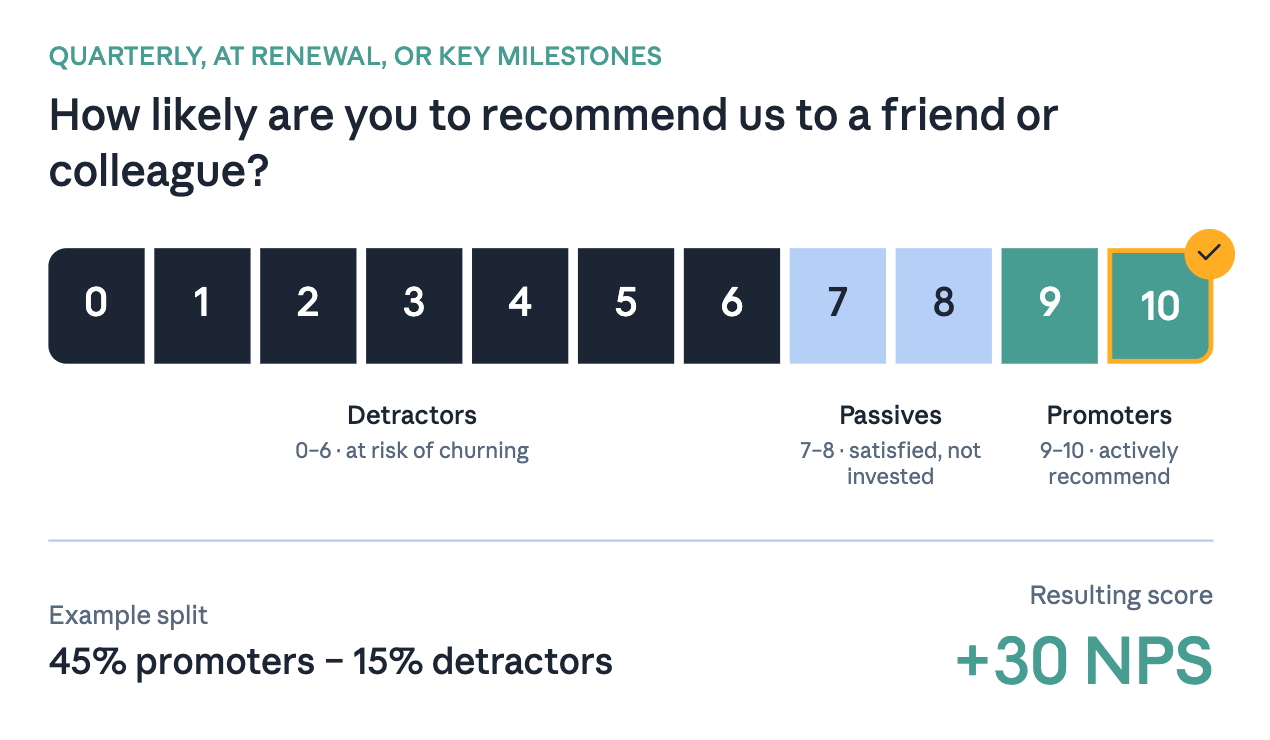
The NPS question: “On a scale from 0 to 10, how likely are you to recommend [company] to a friend or colleague?”
How does NPS segment customers?
Responses sort customers into three groups:
- Promoters (9-10): Loyal customers who actively recommend you and buy more over time.
- Passives (7-8): Satisfied, but not invested. They’ll leave for a competitor’s better offer without a second thought.
- Detractors (0-6): Unhappy customers at risk of churning, and actively willing to talk you down to others.
How do you calculate NPS?
NPS = % of Promoters − % of Detractors
The score ranges from -100 to +100. Anything above 0 is good. Above 50 is excellent.
Treat that benchmark as US-calibrated, not universal. Customers rate on a 0–10 scale differently by culture: Americans use the extremes more freely, while European customers rarely give a 10 even for excellent service and treat an 8 as a solid score. The same experience can produce a very different number depending on who’s answering, and both CSAT and NPS carry this bias. For a company operating across regions, compare NPS against its own trend and against similar regions rather than against a single global threshold.
The reverse of the CSAT scenario is true too. One poor support interaction might dent CSAT, but it won’t undo years of trust on its own. A falling CSAT score deserves investigation. It doesn’t deserve panic.
CSAT vs NPS: which one should you use?
|
Question |
CSAT |
NPS |
|
What does it measure? |
Satisfaction with one interaction (ad hoc), or the relationship as a whole (scheduled) |
Overall customer loyalty |
|
Main question |
“How satisfied were you?” |
“How likely are you to recommend us?” |
|
Best timing |
Immediately after a support interaction, or on a scheduled cadence for contract customers |
Quarterly, at renewal, or key milestones, or folded into a periodic CSAT relationship survey (e.g. every six months) |
|
Helps you improve |
Individual interactions |
The overall customer experience |
|
Typical action |
Coach agents and fix process issues |
Improve retention and reduce churn |
Choose CSAT for a real-time pulse on service quality. Choose NPS to track loyalty over time. The strongest brands don’t choose. They run both, because CSAT catches today’s problem and NPS catches the one you haven’t noticed yet.
Account size and complexity matter too. CSAT tends to hold up better for enterprise and global accounts, where the interaction-level detail and a consistent question support decisive coaching, and where regional score bias is easier to account for at the individual-response level. NPS earns its keep more with smaller, single-region accounts, where a company-wide loyalty number is simpler to interpret and compare.
How to run both without survey fatigue
The challenge isn’t deciding whether to collect CSAT or NPS. It’s collecting both without wearing your customers out.
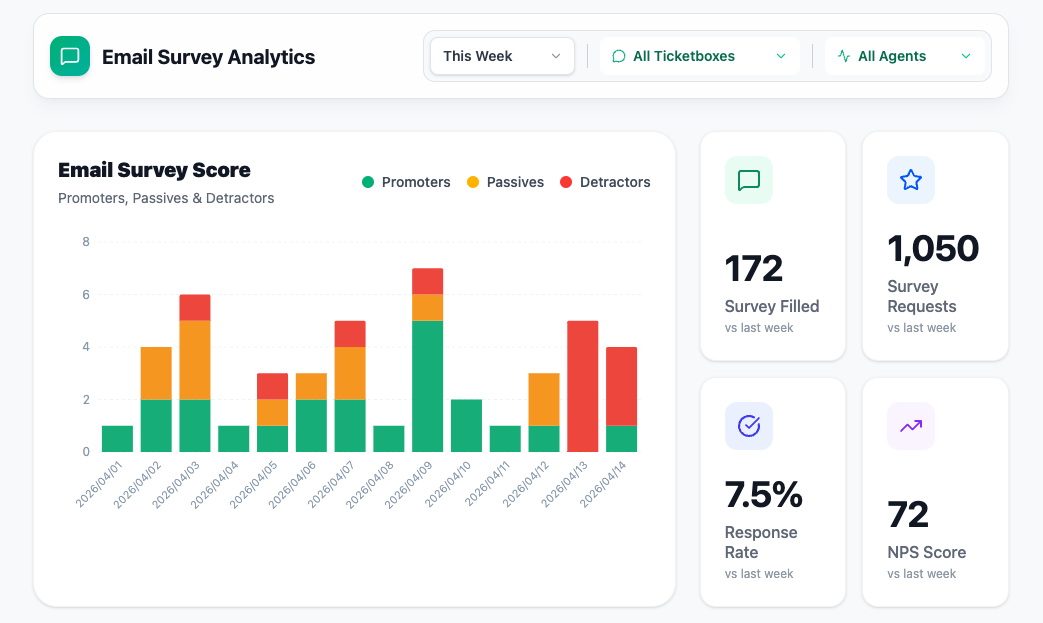
One model: FocalScope automates this by sending CSAT immediately after ticket resolution, across email, live chat, WhatsApp, and voice, and social, while scheduling NPS separately on its own cadence. Customers aren’t asked the same question twice in one week.
At the enterprise level: a single CSAT survey, sent on a fixed cadence to the full customer base rather than triggered by one ticket, can carry several topic questions plus a direct recommend or continue question. One send gives you satisfaction, a topic-level breakdown of what’s driving it, and loyalty, without diluting any of the three.
At the ad-hoc level: pair the single CSAT question about that specific interaction with an NPS-style recommend question, both sent the moment the ticket closes. This is a recognised pattern in its own right, sometimes called transactional NPS, distinct from the periodic relationship NPS most benchmarks are built on.
One caveat worth knowing before you rely on it: transactional NPS tends to score higher than relationship NPS for structural reasons that have nothing to do with performance. It reaches only customers who just chose to interact with you, scoring a fresh, usually successful event, while a relationship survey reaches everyone, including the disengaged and the quietly unhappy, and reflects the accumulated relationship rather than one good outcome. Treat the two as separate readings. A strong post-ticket NPS next to a weaker quarterly NPS isn’t a contradiction — it’s two different populations answering two different questions.
Surveys go out automatically, with no manual sending required. If a response comes back low, FocalScope can alert the relevant manager the moment it happens, so a bad score triggers action instead of sitting unread in a report.
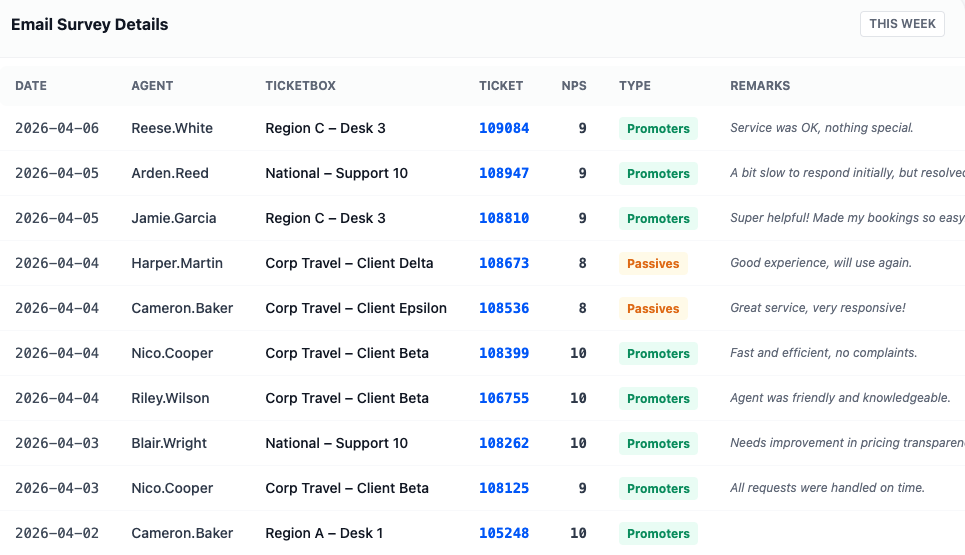
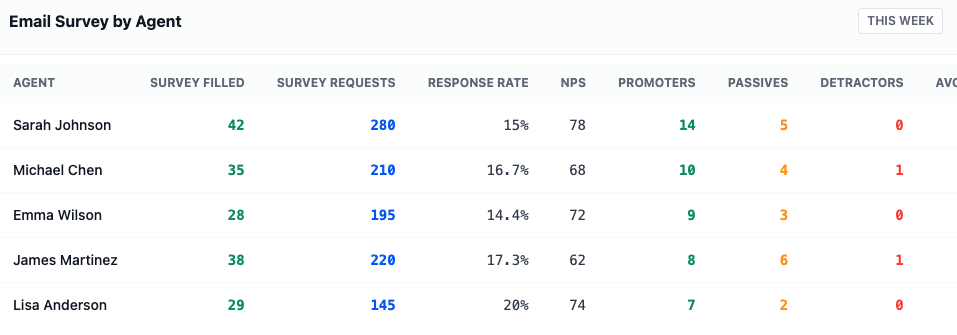
Results feed into real-time dashboards alongside ticket history. You can zoom out to spot CSAT and NPS trends across the whole team, or zoom in to review the score behind a single agent, channel, or conversation. That makes it easy to identify whether changes in loyalty coincide with a particular team, channel, or stage of the customer journey, and whether a low CSAT score is a one off issue or the start of a wider trend.
Frequently asked questions
Can you have high CSAT and low NPS?
Yes, and it’s more common than most teams expect. It means support is doing its job well, but something outside support, pricing, the product itself, account management, is quietly eroding loyalty. High CSAT with flat or falling NPS is a sign the problem sits above the support team, not inside it.
Can you have high NPS and low CSAT?
Yes. A loyal, long-term customer can still rate a single frustrating interaction poorly. That’s not a warning that they’re leaving. It’s a warning that one experience didn’t meet the standard they’re used to, and it’s worth fixing before it becomes a pattern.
Which is more important, CSAT or NPS?
Neither. They answer different questions, and using one to answer the other’s question is how teams miss both a service problem and a loyalty problem at the same time. Track CSAT to catch service issues immediately. Track NPS to catch loyalty issues before they show up as churn.
How often should you send NPS surveys?
Quarterly is the most common cadence, though many teams also trigger NPS at natural milestones: after renewal, after onboarding, or after a major product change. Sending it too often causes survey fatigue and drags down response rates. That’s the standalone NPS cadence. Teams running a periodic relationship CSAT survey instead don’t need a separate NPS schedule at all, since the loyalty question already sits inside it.
How often should you send CSAT surveys?
Immediately after each resolved interaction, while it’s still fresh. Waiting even a day or two lowers both response rates and accuracy, since the customer’s memory of the interaction fades fast. That’s the standard trigger for transactional CSAT. Larger enterprise accounts often run CSAT periodically as well, for example every six months to the full customer base, covering several topics and loyalty in one survey rather than one per ticket.
What’s a good CSAT score?
Above 75-80% is generally considered healthy, though this varies by industry. What matters more than the number itself is the trend: a steady decline is worth investigating even if the score is still technically “good.”
What’s a good NPS score?
Above 0 is positive. Above 50 is excellent and puts you among the best-performing companies in most industries. These benchmarks are US-calibrated. Customers score differently by culture, and European or Asian customers typically give fewer 9s and 10s than American customers for the same experience, so trend and regional comparison matter more than the raw number.
Related Topics


Custom Wiki Knowledgebase

Call Routing &
SLA Customisations
The takeaway
CSAT and NPS aren’t competing metrics. They answer different questions.
CSAT tells you whether today’s interaction met expectations. NPS tells you whether customers still believe in your business tomorrow. Track only one, and you’re flying half-blind. Track both, and you catch service problems immediately while spotting loyalty risk before it turns into churn. When your customers are businesses rather than individuals, a periodic CSAT survey can carry both jobs: built around the topics that matter most to the account, with its own loyalty question alongside them, it does what NPS does but with far more detail behind the number.
Together, they connect what happened in a single interaction with how customers feel about your business over time.
See how FocalScope helps you automate CSAT and NPS surveys, uncover customer trends, and turn feedback into action. Book a guided demo.