










- Home
- What's new at FocalScope
- Customer service reports
Five monthly reports that show where demand comes from, how fast you respond, and what to fix next.
The five support reports team leads should run every month are: ticket volume and channel trends, response and resolution time, SLA performance, backlog and ticket ageing, and agent workload. Together they show where demand is coming from, how fast you respond, whether you keep your promises, what is piling up, and whether work is shared fairly.
Daily dashboards help you manage the queue in front of you. Monthly support reporting shows the patterns behind it, so you can make better decisions on staffing, workflows, training and service levels instead of reacting to each spike.
Key Takeaways
- Run all five reports monthly, then compare each against the previous month and the same month last year.
- Always report median alongside average response and resolution times. Outliers distort averages.
- Segment every report by channel, priority, and category. Blended numbers hide the real problem.
- End each review with two or three owned actions, not a list of observations.
Monthly Support Reporting at a Glance
| Report | Key Metrics | Question It Answers | Action It Drives |
| 1. Ticket volume and channel trends | Total volume, channel mix, peak times, top categories | Where and when is demand coming from? | Shift coverage, forecasting, root-cause fixes |
| 2. Response and resolution time | FRT, resolution time (average and median) | How fast do customers get answers and fixes? | Process bottleneck removal |
| 3. SLA performance | SLA compliance %, breach count, breach segmentation | Are we keeping our service promises? | Escalation and handoff fixes |
| 4. Backlog and ticket ageing | Open tickets, age bands, at-risk tickets | What is waiting, and for how long? | Ticket sweeps, capacity planning |
| 5. Agent workload and performance | Tickets handled, handle time, CSAT, escalation rate | Is work distributed fairly and sustainably? | Routing rules, coaching, workload balance |
1. What Is a Ticket Volume and Channel Trends Report?
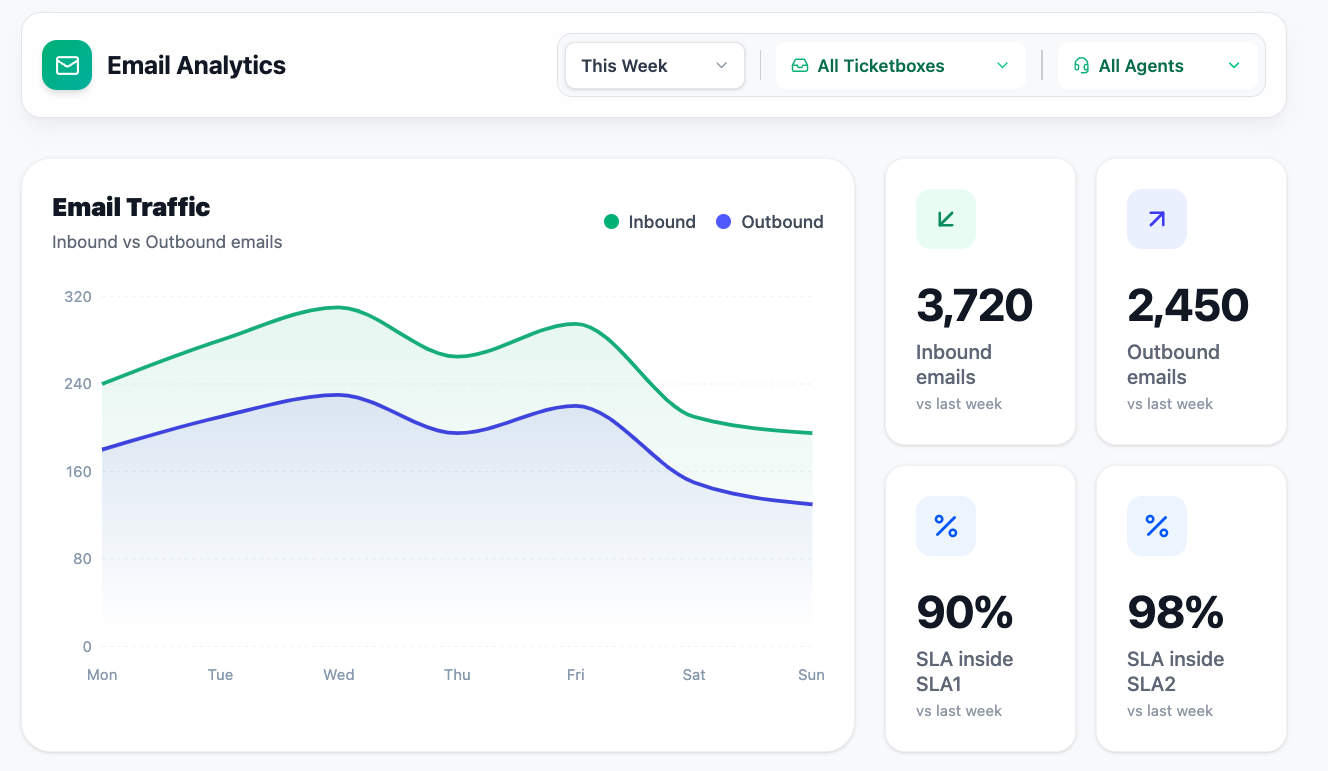
A ticket volume report tracks how many support requests arrive each month, broken down by channel (email, voice, live chat, WhatsApp, social media), enquiry category, and time of day or day of week.
Why it matters: Volume is the clearest signal of customer demand. A spike in email after a product release points to a product issue. Rising live chat or WhatsApp volume shows customers moving towards instant channels.
Metrics to track:
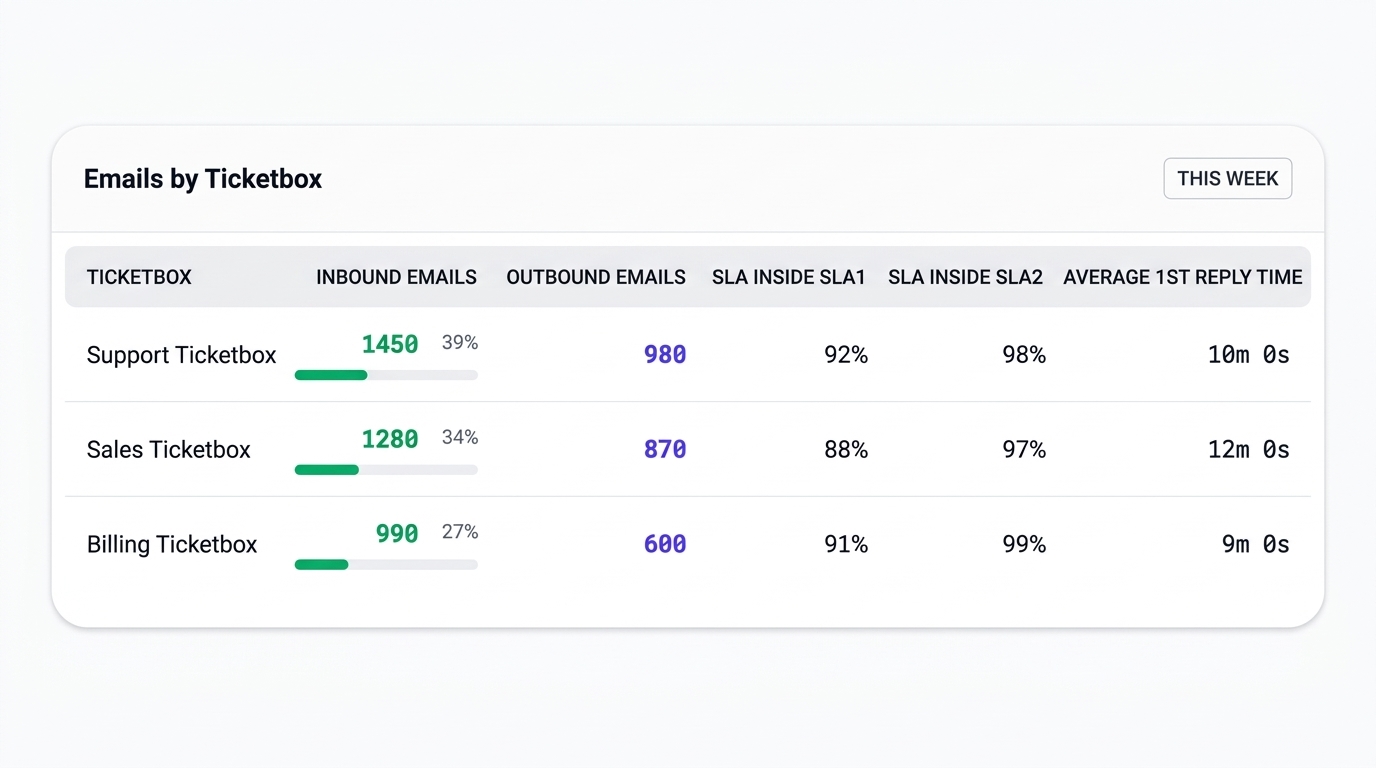
- Total enquiries: inbound vs. resolved
- Channel distribution: share of volume per channel, month over month
- Temporal patterns: volume by hour and by weekday
- Top enquiry categories: the most frequent tags and root causes
How to act on it: Look for channel shifts and recurring spikes. Use them to adjust shift rosters, refine automated triage, and send your most common issues to product and documentation teams.
FocalScope tip: Use folder mapping and ticket tagging to view volume by enquiry category across every channel in a single report. AI categorisation on incoming email and calls keeps those categories consistent, so the report reflects what customers actually asked about.
2. What Is a Response and Resolution Time Report?
A response and resolution time report measures two things: First Response Time (FRT), how long a customer waits for a first human reply, and Resolution Time, how long from ticket creation until the issue is solved.
Why it matters: Comparing the two exposes where time is lost. A team can reply within minutes yet take days to resolve because of slow back-end processes or long escalation loops.
Metrics to track:
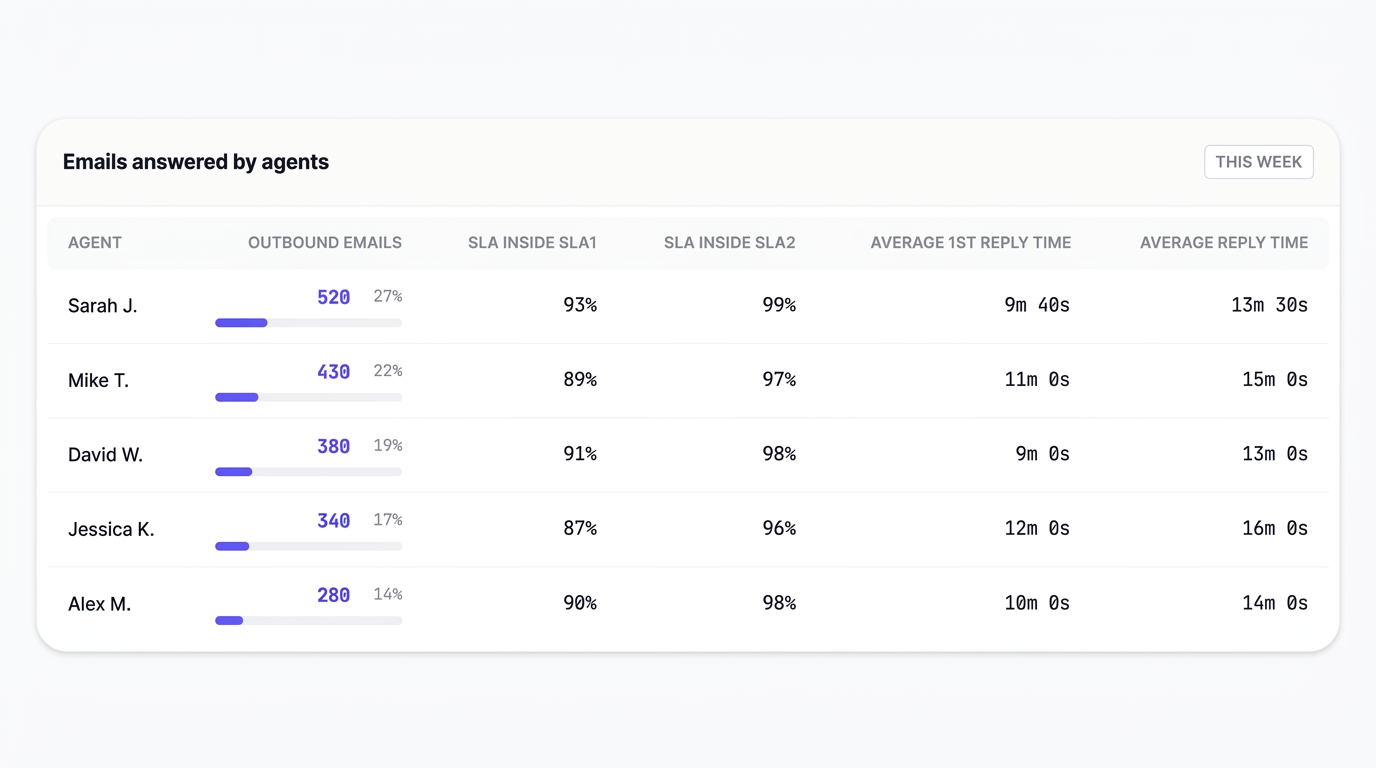
- Average and median FRT
- Average and median resolution time
- Both metrics broken down by channel, priority and category
How to act on it: Watch for rising times when volume is stable, which signals a process problem rather than a capacity one. Always compare median against average. A large gap means a few long-running tickets are distorting the picture.
Note: Faster is not always better. Cutting handle time must never come at the cost of accurate resolution.
FocalScope tip: Run the response and resolution report by channel, priority and category from the built-in Excel templates, and compare median against average in the same sheet.
Run Every Monthly Report in One Place With FocalScope
Monthly reporting only works if data from every channel lands in the same place. FocalScope brings it together:
- Omnichannel reporting: email, voice, live chat, WhatsApp and social data in one platform
- 70+ built-in reports: ticket volume, SLA performance, backlog and agent productivity, delivered as ready-to-use Excel templates
- Customisable Excel engine: filter, adapt and pivot metrics in a familiar format
- Scheduled delivery: reports sent automatically to team leads’ inboxes on the schedule you set
Book a 30-minute demo and see your team’s performance in one view.
Related Topics


Custom Wiki Knowledgebase

Call Routing &
SLA Customisations


